

If you work with data – whether you are an HR manager, accountant, sales analyst, operations head, or business owner – you have almost certainly asked yourself this question at some point: Should I be using Excel or Power BI for this?
Both tools come from Microsoft. Both are designed to help you analyze data and create reports. Both are widely used across industries. Yet they are fundamentally different in how they work, what they are best at, and who should be using them.
This guide cuts through the confusion with a thorough, honest, side-by-side comparison of Excel and Power BI across every dimension that matters: features, cost, performance, learning curve, collaboration, visualisation, and real-world use cases. By the end, you will know exactly which tool fits your situation – and why.
What Is Excel? What Is Power BI?
Before comparing the two tools, it is important to understand what each one was designed to do – because they were built with very different purposes in mind.
Microsoft Excel
Excel is a spreadsheet application that has been the global standard for data management, calculation, and reporting since 1985. It organises data in rows and columns, and gives users tools for formulas, pivot tables, charts, conditional formatting, and VBA automation. Excel is the tool of choice for individual data work – building models, running calculations, preparing formatted reports, and doing ad-hoc analysis.
Excel is part of the Microsoft Office suite and is available as a standalone purchase or through a Microsoft 365 subscription. Almost every professional has used it at some point.
Microsoft Power BI
Power BI is a business intelligence and data visualisation platform launched by Microsoft in 2015. Unlike Excel, Power BI is purpose-built for creating interactive dashboards and reports that connect to live data sources and can be shared across an entire organisation. Power BI is cloud-first, collaboration-focused, and designed to handle large datasets that would overwhelm Excel.
Power BI consists of three components: Power BI Desktop (free download for building reports), Power BI Service (cloud platform for sharing), and Power BI Mobile (for viewing reports on phones and tablets).
The Key Mindset Difference: Excel is a personal productivity tool – you work in it, build something, and share the output (a PDF, a formatted sheet, a pivot table). Power BI is an organizational intelligence platform – you build reports once and publish them so that many people can interact with them in real time, with live data always flowing in.
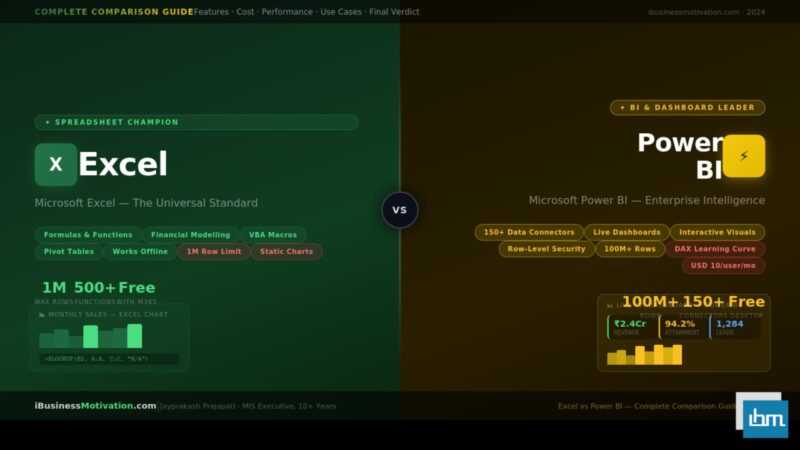
The Complete Feature-by-Feature Comparison
Here is an exhaustive, side-by-side comparison across every major dimension. This is the most important table in this article – read each row carefully, because the differences are often significant.
| Feature / Dimension | Excel | Power BI |
| Primary purpose | Spreadsheets, calculations, financial models | Interactive dashboards, BI reporting |
| Data entry | Direct manual entry into cells | Via data connectors – not for manual entry |
| Formula engine | Rich formula library (500+ functions) | DAX (Data Analysis Expressions) – powerful but different |
| Max row limit | 1,048,576 rows per sheet | Effectively unlimited (100M+ rows with Premium) |
| Data connections | Basic: CSV, XLSX, ODBC, limited web | Advanced: 150+ connectors (SQL, Salesforce, Google Analytics, REST APIs, Azure, etc.) |
| Visualisations | Charts, sparklines, conditional formatting | 50+ interactive visual types, custom visuals marketplace |
| Interactivity | Limited (slicers, filter dropdowns) | Full cross-filtering, drill-through, bookmarks, buttons |
| Dashboard sharing | Email attachments or SharePoint | Cloud publish – anyone with a link can view live |
| Real-time data | No native live refresh | Yes – automatic scheduled refresh (15 min to daily) |
| Collaboration | Multiple users cause conflicts | True multi-user via workspaces and roles |
| Mobile access | Excel app (limited) | Dedicated Power BI Mobile app with full interactivity |
| Automation | VBA Macros, Power Query | Power Automate, dataflows, incremental refresh |
| Learning curve | Low to medium | Medium to high (DAX is a new language) |
| Cost (basic) | Included in Microsoft 365 (~INR 550/month) | Power BI Desktop: Free | Pro: ~USD 10/user/month |
| Best for data size | Up to ~100K rows comfortably | Millions of rows without performance issues |
| Offline use | Full – works completely offline | Desktop is offline; sharing requires internet |
| Pivot tables | Excellent, mature, flexible | Power Pivot (Excel) or visual matrix in Power BI |
| Statistical analysis | Strong (ANOVA, regression via Analysis ToolPak) | Basic – not designed for statistical computation |
| Custom calculations | Formulas + VBA | DAX measures and calculated columns |
| Version history | Manual saves or SharePoint versioning | Built-in version history in Power BI Service |
Data Handling and Performance
Data volume is one of the most important factors when choosing between Excel and Power BI. As your data grows, the performance gap between the two tools becomes very significant.
Excel and Data Volume
Excel has a hard limit of 1,048,576 rows per worksheet. In practice, Excel performance degrades meaningfully beyond 100,000 to 200,000 rows – especially when you add formulas, pivot tables, and conditional formatting. Files get slow to open, formulas take seconds to calculate, and operations like filtering or sorting become sluggish.
For most individual and small-team reporting needs – up to 50,000 rows of clean, structured data – Excel performs comfortably. For medium-to-large enterprise data, Excel is the wrong tool.
Power BI and Data Volume
Power BI uses a columnar, in-memory engine called VertiPaq that compresses and stores data extremely efficiently. Power BI Desktop handles tens of millions of rows on a standard laptop. Power BI Premium (enterprise tier) can handle hundreds of millions of rows with fast query response times.
More importantly, Power BI can connect directly to databases like SQL Server, Azure Synapse, or BigQuery without importing the data – known as DirectQuery mode. This means Power BI can report against a live database of billions of rows without ever loading the data into the file.
| Metric | Excel | Power BI |
| Comfortable row limit | Up to 100,000–200,000 | 10M+ (Desktop), 100M+ (Premium) |
| File size (1M rows) | ~50–200MB, very slow | ~10–30MB compressed, fast |
| Formula recalculation | Slows significantly above 100K rows | Not applicable – DAX is query-based |
| Live database connection | No (import only) | Yes – DirectQuery, Live Connection |
| Refresh frequency | Manual / on file open | Automated: every 15 min to daily |
| RAM requirement for large data | Very high (often causes crashes) | Moderate (VertiPaq compression) |
Visualisation and Reporting Capabilities
Both tools can create charts and visual reports, but the nature, quality, and interactivity of those visuals are very different.
Excel Visualisation
Excel offers a solid library of standard chart types: bar, column, line, pie, scatter, area, combo, waterfall, funnel, treemap, sunburst, and more. Conditional formatting adds a layer of visual intelligence to cells themselves. Sparklines allow tiny in-cell charts.
Excel charts are static by default. When you email a report or share a printed PDF, the charts look professional and clean. However, they do not respond to clicks, filters, or interactive selections. Making a chart dynamic requires significant manual effort with slicers, named ranges, or VBA.
Power BI Visualisation
Power BI was built for visualisation first. It ships with 30+ standard visuals – bar, line, map, treemap, gauge, KPI card, waterfall, ribbon chart, decomposition tree, key influencer chart, and more. The AppSource marketplace adds hundreds of free and paid custom visuals built by the community.
Every Power BI visual is interactive by default. Clicking a bar in one chart automatically filters every other visual on the page. Drill-through lets users navigate from a summary visual to a detailed page. Bookmarks and buttons create guided navigation experiences. These capabilities transform a static report into a self-service analytics tool.
| Visual Feature | Excel | Power BI |
| Standard chart types | ~20 types | 30+ types plus 300+ marketplace visuals |
| Chart interactivity | Static (requires slicers/VBA) | Full cross-filtering by default |
| Map visuals | Basic Bing maps | Filled maps, Azure Maps, ArcGIS, shape maps |
| Custom visuals | No | Yes – free AppSource marketplace |
| Mobile-optimised layout | No | Yes – dedicated phone layout view |
| Drill-down in visuals | Limited | Full drill-down and drill-through built-in |
| Tooltips | Basic | Custom tooltip pages with full visuals |
| Themes | Basic colour themes | Full JSON theme customisation |
| Conditional formatting | Excellent – cells, bars, icons | Available on tables/matrices |
| Report bookmarks | No | Yes – save and navigate report states |
Learning Curve and Skill Requirements
One of the most practical questions anyone asks before adopting a new tool is: how long will it take me to learn this? The answer is very different for Excel and Power BI.
Learning Excel
Excel has an extremely gentle entry point. You can start entering data, writing simple formulas, and building basic charts within a single afternoon. The VLOOKUP/XLOOKUP, pivot tables, and conditional formatting learning curve takes a few days to a few weeks for most people. Advanced topics like Power Query, Power Pivot, and VBA macros take months of regular practice.
The enormous advantage of Excel is that nearly every colleague, employer, and online resource already speaks Excel. There are thousands of free tutorials, YouTube channels, and courses. Help is always one search away.
Learning Power BI
Power BI has a steeper learning curve than Excel, primarily because of DAX – the formula language used to create calculated measures and columns. DAX is conceptually different from Excel formulas because it operates on tables and filter contexts rather than individual cells. Understanding how filter context works is the core challenge that trips up most beginners.
That said, Power BI Desktop is free to download and Microsoft offers extensive free learning resources at learn.microsoft.com. The PL-300 certification (Microsoft Power BI Data Analyst) is a recognised credential that validates intermediate Power BI skills.
| Learning Milestone | Excel | Power BI |
| Basic data entry & formulas | 1–2 days | Not applicable (not a data entry tool) |
| Create a usable report/chart | 1–3 days | 1–2 weeks |
| Pivot tables / data modelling | 1–4 weeks | 2–8 weeks (DAX required) |
| Advanced analysis & automation | 3–12 months | 3–12 months |
| Enterprise-level deployment | Years of experience | PL-300 certification + experience |
| Free learning resources | Abundant | Abundant (Microsoft Learn) |
| Availability of training courses | Extremely common | Growing rapidly |
Cost and Licensing Breakdown
Cost is a real consideration for individuals, small businesses, and large enterprises. Here is a clear breakdown of what each tool costs.
Excel Licensing
- Microsoft 365 Personal (includes Excel): approximately INR 4,899/year (~INR 408/month)
- Microsoft 365 Business Basic (includes Excel): approximately USD 6/user/month
- Microsoft 365 Business Standard (includes all Office apps): approximately USD 12.50/user/month
- Excel standalone (one-time purchase, Office 2021): approximately USD 130 – no subscription needed
Power BI Licensing
- Power BI Desktop: Free – download and use with no cost, ever
- Power BI Pro: USD 10/user/month – required to share and publish reports to colleagues
- Power BI Premium Per User (PPU): USD 20/user/month – advanced features, larger datasets
- Power BI Premium (capacity-based): USD 4,995/month – enterprise, unlimited viewers
- Power BI is included free with Microsoft 365 E5 licences
| Cost Scenario | Excel | Power BI |
| Individual use only | Included in M365 (~INR 408/month) | Free (Desktop only, no sharing) |
| 1 user sharing reports | M365 subscription needed | USD 10/month (Pro) |
| Small team (5 users) | M365 for team (~USD 62/month total) | USD 50/month total (Pro) |
| Large org (100 users) | M365 already covers it | USD 1,000/month (Pro) or Premium |
| Free tier available? | No (trial only) | Yes – Desktop is free, forever |
For most organisations already paying for Microsoft 365, Excel is effectively zero additional cost. Power BI Pro requires an additional USD 10/user/month on top of an existing M365 subscription if you need to share reports with colleagues. Power BI Desktop alone (for personal use, no sharing) is always free.
Collaboration and Sharing
How you share and collaborate on data is an often-overlooked but critically important factor in choosing the right tool.
Collaboration in Excel
Excel collaboration has improved significantly with Microsoft 365. Multiple users can now co-author a workbook simultaneously in the browser or desktop app. However, real-world collaboration in Excel still causes problems: merge conflicts when editing the same cell, confusion over which version is current, and the classic email-attachment chain where five versions of the same file end up in five different inboxes.
Sharing an Excel report means sending a file. The recipient gets a snapshot of the data at the time you sent it. If the underlying data changes after you send the file, the recipient’s copy is already stale.
Collaboration in Power BI
Power BI was designed for organisational sharing from day one. When you publish a report to Power BI Service, you share a link – not a file. Every person who opens that link sees the same, always-current version of the report. No version conflicts. No stale snapshots. No email attachments.
Power BI workspaces allow teams to collaborate on building reports together with role-based access: Admin, Member, Contributor, and Viewer. Row-level security (RLS) means different users see only the data they are authorised to view – automatically, without creating separate report versions.
| Sharing Feature | Excel | Power BI |
| Simultaneous editing | Yes (with M365, limited) | Yes – full workspace collaboration |
| Share live data (not a snapshot) | No – file is static at send time | Yes – published reports are always live |
| Version control | Manual or SharePoint | Built-in – Power BI Service versioning |
| Row-level security (RLS) | No native RLS | Yes – built-in, granular RLS |
| Audience-specific views | Manual: create separate files | Automatic with RLS and roles |
| Embed in websites/apps | No | Yes – embed in SharePoint, Teams, web |
| Microsoft Teams integration | Basic file sharing | Deep integration – live reports in Teams |
Real-World Use Cases – Which Tool Wins?
The best way to decide between Excel and Power BI is to look at real scenarios. Here are eight common data analysis situations with a clear recommendation for each.
| Use Case | Recommended Tool | Why |
| Monthly P&L report for CFO (formatted, printable) | Excel | Excel’s formatting control and formula precision are unmatched for financial statements |
| Live sales dashboard for 50 regional managers | Power BI | Real-time data, RLS per region, one report for all – impossible with Excel |
| One-time data cleanup and analysis | Excel | Ad-hoc manipulation and cell-level editing is Excel’s strength |
| Company-wide KPI dashboard refreshed daily | Power BI | Automated refresh, interactive visuals, shared via single link |
| Payroll calculation with complex formulas | Excel | Formula-based computation is Excel’s core competency |
| Analysing 5 million rows of transaction data | Power BI | Excel would crash – Power BI handles this comfortably |
| Building a financial model for investors | Excel | Investors expect Excel models – structure, auditability, formulas |
| HR attrition trend analysis across 10 departments | Power BI | Multi-dimension interactive analysis with drill-down is Power BI’s speciality |
Pros and Cons Summary
Excel – Pros and Cons
Excel Strengths: Universally known by virtually every professional | Best-in-class for formulas, calculations, and financial modelling | Complete offline functionality | Full control over cell-by-cell formatting | Excellent for building structured templates and forms | Supports VBA macros for task automation | Works as a complete database substitute for small datasets | No extra licensing cost if you already have Microsoft 365
Excel Limitations: Hard row limit of 1,048,576 rows – inadequate for big data | Performance degrades significantly above 200K rows | Sharing creates version and consistency problems | No true live data refresh – reports go stale | Charts are static with limited interactivity | Not designed for cross-organisational reporting | Collaboration can cause conflicts and overwrites
Power BI – Pros and Cons
Power BI Strengths: Handles millions of rows without performance loss | 150+ native data connectors for almost any source | Live, auto-refreshing dashboards visible across the organisation | Deeply interactive visuals with cross-filtering and drill-through | Row-level security for audience-specific data access | Tight integration with Microsoft Teams, SharePoint, Azure | Active and growing community with thousands of custom visuals | Power BI Desktop is permanently free
Power BI Limitations: DAX is a new language with a real learning curve | Not suitable for manual data entry or cell-level editing | Sharing reports requires Power BI Pro (USD 10/user/month) | Less control over pixel-perfect print formatting | Cannot replace Excel for financial modelling or formula-heavy calculations | Requires internet for sharing and cloud features | Some advanced features require Premium (expensive)
Should You Learn Excel or Power BI First?
This is one of the most common questions from professionals and students entering the data field. The answer depends on your role and goals – but there is a clear logical order.
- Learn Excel first if you are new to data work. Excel teaches you the fundamental concepts: data structure, formulas, aggregation, charting. These concepts transfer directly to Power BI.
- Move to Power BI when your reporting needs outgrow Excel – when your data is too large, you need to share live reports with many people, or your organisation is adopting Power BI at scale.
- Learn both if you work in data analysis, finance, or business intelligence. The two tools complement each other – Excel for individual modelling and calculation, Power BI for organisational reporting and dashboards.
- Start with Power BI if your role is specifically BI or data analyst and your organisation already uses Power BI. Microsoft Learn offers a free, structured learning path that takes you from zero to job-ready.
The Honest Answer for Most Professionals: If you work in finance, accounting, or operations – master Excel first, then learn Power BI. If you work in data analytics, BI, or strategy – prioritise Power BI while maintaining Excel fluency. If you are a business owner or manager – hire someone who knows both, or learn Excel to intermediate level yourself.
Frequently Asked Questions
No – and Microsoft itself does not position Power BI as an Excel replacement. They are complementary tools. Power BI cannot replicate Excel’s formula engine, financial modelling capabilities, manual data entry, or precise print formatting. Many professionals use both together: Excel for calculation and modelling, Power BI for interactive reporting.
Power BI’s interface is learnable within a few weeks. The hard part is DAX – the formula language. DAX logic (filter context, row context, CALCULATE function) is genuinely different from Excel thinking and requires real study. Expect 2 to 3 months of regular practice before DAX starts feeling natural.
Yes, very well. You can import Excel files directly into Power BI. Power BI supports Excel workbooks as data sources. Organisations commonly use Excel for data collection and modelling, then connect Power BI to those Excel files to create live dashboards. Power Query – used in both tools – makes the connection seamless.
If you are already paying for Microsoft 365, Excel is included – use it. For simple reporting needs with limited sharing requirements, Excel is the cost-effective choice. If you need live dashboards shared across a team, Power BI Pro at USD 10/user/month is very reasonable. Power BI Desktop is always free if you only need personal reports.
Yes. The drag-and-drop report builder in Power BI Desktop requires no coding. You can connect to data, build visuals, and publish reports without writing a single line of code. DAX becomes necessary when you need complex calculations, but even basic Power BI reports can be built with zero coding knowledge.
Both appear heavily in job descriptions. Excel is listed as a required skill in a far larger percentage of all jobs because of its universal nature. Power BI is increasingly listed as a required or preferred skill in analytics, BI, and data analyst roles specifically. For maximum career flexibility, proficiency in both is the strongest position.
Yes. The Power BI Mobile app (iOS and Android) lets you view and interact with all your published reports and dashboards. Report authors can create a dedicated phone layout for each report page, optimised for vertical screens. Excel’s mobile app is more limited in what it can display and edit comfortably on a phone.
The Final Verdict: Excel vs Power BI
After a thorough comparison across features, performance, cost, learning curve, collaboration, and real-world use cases, here is the definitive guidance:
| Your Situation | Best Tool | Reason |
| Individual data work, formulas, small datasets | Excel | Faster, more flexible, no extra cost |
| Financial modelling and precision calculations | Excel | Nothing matches Excel’s formula depth |
| Sharing dashboards with a large team | Power BI | Live data, single link, no version conflicts |
| Analysing data above 500K rows | Power BI | Excel performance breaks down; Power BI thrives |
| Ad-hoc analysis with manual editing | Excel | Direct cell manipulation – Power BI cannot do this |
| Enterprise BI reporting across departments | Power BI | Designed exactly for this purpose |
| You are new to data – where to start? | Excel first | Builds foundational data intuition |
| You want both tools | Learn both | They are designed to complement each other |
The most important takeaway is this: Excel and Power BI are not competitors. They are partners. Microsoft designed them to work together. Excel handles the granular, formula-driven, individual work. Power BI handles the organisational, visual, large-scale reporting work. The professionals who master both are the most valuable data people in any organisation.
Free Excel Tools at ibusinessmotivation.com: If you are working in Excel and want to automate the most time-consuming parts of your workflow – merging files, cleaning data, splitting sheets by region – visit ibusinessmotivation.com for free browser-based tools. No software installation, no VBA required, no technical skill needed.