

In today’s data-driven world, decision-making depends heavily on how efficiently you can visualize your business data. An interactive Excel dashboard helps you transform plain numbers into actionable insights giving you a clear picture of performance, trends, and KPIs (Key Performance Indicators) all in one place.
Whether you’re a sales manager, accountant, HR executive, or small business owner, dashboards make it easier to track metrics like sales growth, expenses, profit margins, and employee performance in real time.
The best part? You don’t need advanced software or coding skills. Microsoft Excel itself is a powerful dashboard creation tool when used effectively.
In this guide, you’ll learn how to create interactive dashboards in Excel step-by-step from preparing data to adding dynamic visuals so you can make informed business decisions faster and smarter.
Understanding What an Excel Dashboard Is.
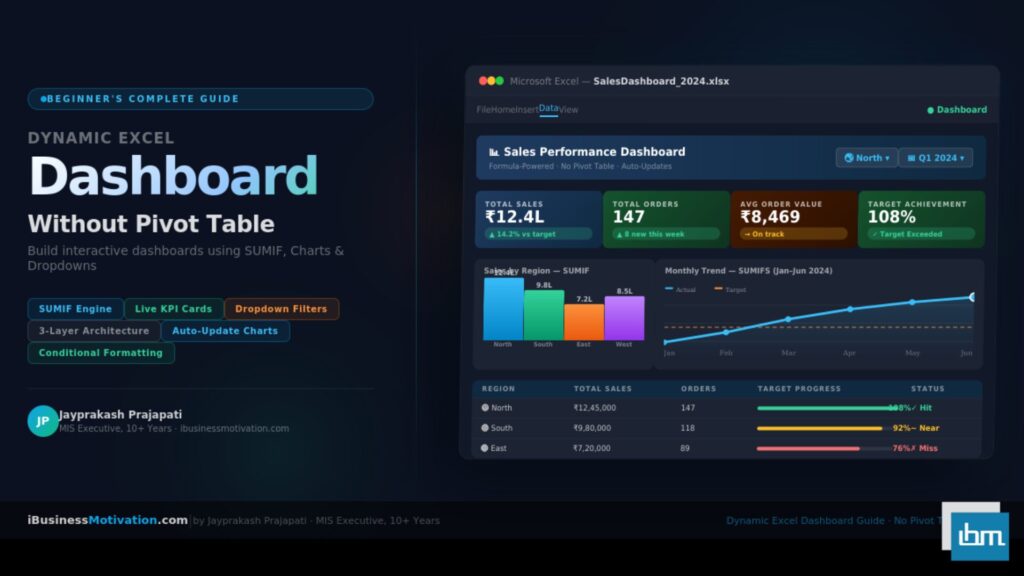
An Excel dashboard is a visual representation of data that allows users to interact with charts, graphs, and reports. It gives a bird’s-eye view of key metrics, helping managers and stakeholders understand performance at a glance.
Think of it as your business control center where you monitor sales, analyze trends, and identify issues before they become problems.
Core Elements of an Excel Dashboard
- Data tables: The foundation of your dashboard containing all the raw information.
- Charts & graphs: Visual elements like bar charts, line graphs, and pie charts to represent trends.
- Interactive controls: Dropdowns, slicers, checkboxes, and timelines for dynamic filtering.
- KPIs: Key performance indicators to track success metrics like revenue growth or customer retention.
1. Plan Your Dashboard Before You Start
Before jumping into Excel, you must plan your dashboard’s structure. A well-planned dashboard saves hours of rework later.
Step-by-Step Planning Tips:
- Define your goal: What business question should the dashboard answer?
Example: “Which region has the highest sales this quarter?” - Identify KPIs: Choose 4–6 metrics that matter most. Avoid cluttering with too many.
Example: Total Sales, Profit Margin, Monthly Growth Rate, Customer Count. - Gather clean data: Data accuracy is crucial. Remove duplicates, blank rows, and inconsistencies.
- Sketch your layout: Visualize where charts, KPIs, and filters will appear.
- Keep it simple: Aim for clarity, not complexity. A good dashboard tells a story at a glance.
2. Prepare and Organize Your Data
Data preparation is the backbone of dashboard creation. Poor data leads to poor insights.
Tips for Data Organization:
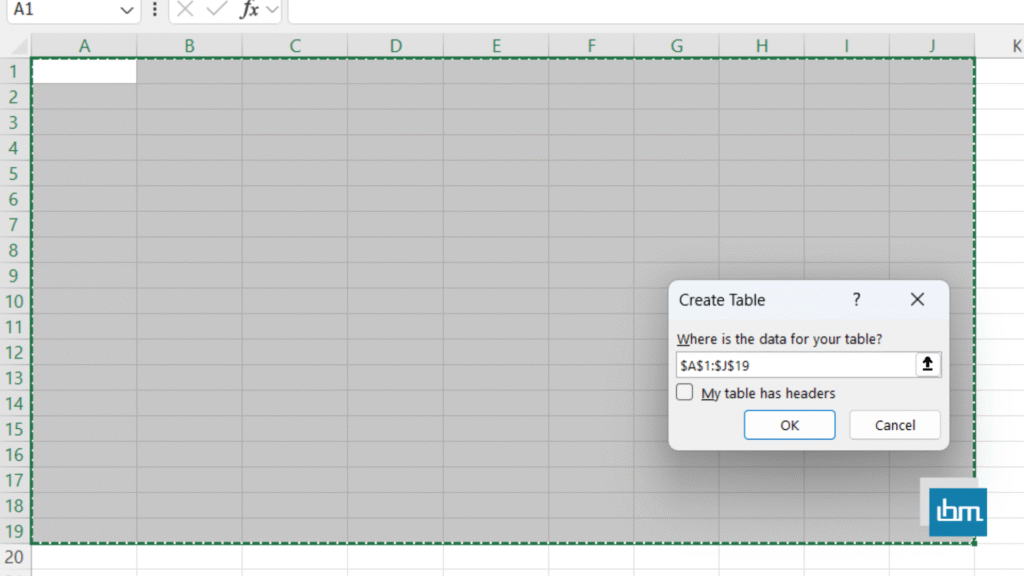
- Store all your data in one table (ideally formatted as an Excel Table using
Ctrl + T). - Use clear headers for each column e.g., Date, Region, Product, Sales, Profit.
- Avoid merged cells and blank spaces.
- Ensure consistent date and number formats.
Create separate sheets for:
- Raw Data
- Data Calculations
- Dashboard Visualization
You can also use Excel’s Power Query tool to clean and combine data from multiple sources like CSVs, databases, or web exports.
3. Add Data Validation and Dynamic Ranges
Once your data is structured, make it dynamic using data validation and named ranges.
Example:
- Use Data Validation to create dropdown lists (for filters like region, month, or category).
- Use Dynamic Named Ranges with formulas like
OFFSET()orINDEX()to automatically include new data as it’s added.
This ensures your dashboard remains interactive and auto-updating, even as data changes over time.
4. Build Pivot Tables for Summarized Insights
Pivot Tables are the heart of most interactive dashboards in Excel. They help you summarize and analyze large datasets quickly.
Steps to Create a Pivot Table:
- Select your data table.
- Go to Insert > PivotTable.
- Choose where to place it (new or existing worksheet).
- Drag fields into Rows, Columns, Values, and Filters.
Example:
- Rows: Region
- Values: Total Sales (Sum)
- Filters: Month or Product Category
Now, you can see regional performance instantly. Combine this with Pivot Charts for stunning visuals.
5. Create Interactive Charts and Visual Elements
After summarizing with Pivot Tables, it’s time to visualize the data.
Common Chart Types for Business Dashboards:
- Column Chart: Compare categories (e.g., sales by region).
- Line Chart: Show trends over time.
- Pie Chart: Display proportions or market share.
- Combo Chart: Combine two datasets, like sales and profit margin.
- Gauge Chart: Represent KPIs visually (e.g., performance score out of 100).
Use Excel’s Insert → Chart menu and link charts to your Pivot Tables for live updates.
6. Add Interactivity with Slicers and Timelines
This is where your dashboard truly becomes interactive.
How to Add a Slicer:
- Click on your Pivot Table or Pivot Chart.
- Go to Insert → Slicer.
- Choose fields like Region, Product Category, or Year.
- Format slicers for easy navigation.
How to Add a Timeline:
- For date-based filtering, go to Insert → Timeline.
- Choose your date field and connect it to your Pivot Table.
Now, users can filter data instantly by clicking buttons instead of scrolling through lists giving your dashboard a professional touch.
7. Design the Dashboard Layout
Your dashboard’s design determines how easy it is for others to read and interpret data.
Design Tips for a Professional Look:
- Use a clean, minimalistic layout (no unnecessary gridlines).
- Group similar charts together.
- Use consistent colors for branding.
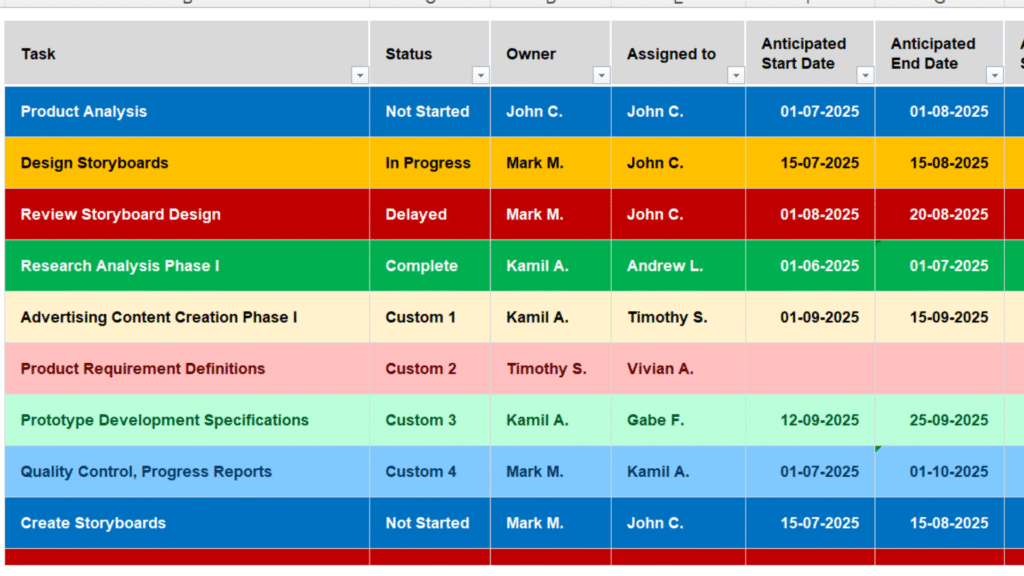
- Highlight key numbers using Conditional Formatting.
- Keep all filters and slicers on one side (left or top) for easy access.
- Add a title, company logo, and update date for professionalism.
A visually appealing dashboard increases user engagement and comprehension.
8. Use Excel Formulas for Automation
To make your dashboard smarter, use Excel formulas for dynamic calculations.
Most Useful Formulas for Dashboards:
SUMIFS()– Conditional sum by multiple criteria.AVERAGEIFS()– Calculate average based on filters.COUNTIFS()– Count entries by category.IF()andIFS()– Apply logic for conditional outputs.VLOOKUP()orXLOOKUP()– Fetch specific data automatically.TEXT()– Format dates and numbers cleanly.
Automation ensures that when new data is entered, your KPIs and charts update instantly no manual work required.
9. Link Everything and Test Interactivity
Once all charts, slicers, and Pivot Tables are ready:
- Link slicers to multiple Pivot Tables (using Report Connections).
- Test each filter to ensure charts update correctly.
- Lock unnecessary sheets to prevent accidental edits.
This final testing step ensures your dashboard runs smoothly for business users.
Dashboards are meant for sharing insights, not just viewing them.
Ways to Make Your Dashboard Shareable:
- Protect formulas and lock the design layout.
- Save as Excel Macro-Enabled Workbook (.xlsm) if you’re using macros.
- Publish to Microsoft Power BI for cloud sharing.
- Convert to PDF for reporting.
- Store it on OneDrive or SharePoint for real-time collaboration.
You can even use Excel Online for team dashboards that update automatically.
10. Real-World Business Dashboard Examples.
Here are some practical dashboard types you can create in Excel:
| Dashboard Type | Purpose | Key Metrics |
|---|---|---|
| Sales Dashboard | Track revenue performance | Sales, Targets, Growth %, Region |
| Finance Dashboard | Monitor expenses & profit | Income, Expenses, Profit Margin |
| Marketing Dashboard | Evaluate campaigns | Leads, Conversion Rate, ROI |
| HR Dashboard | Manage workforce data | Employee Count, Attendance, Attrition |
| Operations Dashboard | Oversee logistics & production | Downtime, Output, Efficiency |
Each dashboard can be customized with slicers, KPIs, and visual themes matching your business identity.
11. Advanced Excel Dashboard Techniques
Once you’re comfortable with basic dashboards, try advanced features like:
- Power Pivot: Handle millions of data rows efficiently.
- Power Query: Automate data import and cleaning.
- Power BI Integration: Turn Excel dashboards into cloud-based reports.
- Macros (VBA): Automate repetitive dashboard tasks.
- Dynamic Arrays: Simplify calculations using functions like
FILTER(),UNIQUE(), andSORT().
These tools help you move from static reporting to real-time business intelligence.
Conclusion.
Creating an interactive Excel dashboard for business is more than a technical task it’s a skill that turns raw data into valuable insights. With clean data, meaningful KPIs, and interactive elements like slicers and charts, you can design a dashboard that empowers decision-makers at every level.
The beauty of Excel lies in its versatility you can build a professional-quality dashboard using just built-in tools, without spending extra on complex software.
So, start today. Take your business data, organize it smartly, and build your first dashboard that tells your business story visually and interactively.