

Imagine typing a plain-English question into Excel – something like Show me the top 5 products by revenue this quarter – and watching Excel instantly create a chart, highlight the relevant rows, and write a summary paragraph for you. No formulas. No pivot tables. No manual filtering. That is exactly what Excel Copilot Agent Mode does.
Microsoft Copilot in Excel is the AI-powered assistant built directly into Microsoft 365. The Agent Mode is its most advanced and interactive form – where Copilot does not just answer one question but takes multi-step actions to complete a full analysis task on your behalf. For beginners who have always found data analysis complex and time-consuming, Copilot Agent Mode is the biggest leap in Excel productivity in a generation.
This complete beginner guide will walk you through everything: what Copilot Agent Mode is, how to enable it, how to write effective prompts, real data analysis examples with actual prompt text, a comparison with doing things manually, common beginner mistakes, and 10 pro tips to get the most out of Excel AI.
What Is Excel Copilot? What Is Agent Mode?
Microsoft Copilot is an AI assistant powered by large language models and integrated directly into Microsoft 365 applications, including Excel, Word, PowerPoint, Outlook, and Teams. In Excel specifically, Copilot can read your data, understand natural language questions, and take actions – such as inserting formulas, creating charts, applying filters, sorting data, and writing analysis summaries.
Standard Copilot mode answers one question at a time. Agent Mode goes further: it can plan and execute a multi-step workflow based on a single instruction. For example, if you say Analyze my sales data and identify anomalies, Copilot Agent Mode will independently decide to first sort the data, then calculate averages, then flag rows that deviate significantly, and finally produce a written summary – all without you specifying each individual step.
| Feature | Standard Copilot | Copilot Agent Mode |
| Interaction style | Single question, single answer | Multi-step autonomous workflow |
| Formula help | Suggests one formula at a time | Writes and inserts complete formula sets |
| Chart creation | Creates chart on direct request | Creates, formats, and labels automatically |
| Data cleaning | Identifies issues on request | Removes duplicates and fixes formats autonomously |
| Analysis depth | Surface-level summary | Deep pattern detection and anomaly flagging |
| Best suited for | Quick lookups and simple one-step tasks | Full end-to-end data analysis projects |
The biggest barrier to data analysis for beginners has always been knowing which steps to take and in what order. Agent Mode removes that barrier entirely. You describe the outcome you want, and Copilot figures out the steps. You do not need to know pivot tables, XLOOKUP, or conditional formatting to get professional-quality analysis output.
System Requirements – What You Need to Use Excel Copilot
Before using Excel Copilot or Agent Mode, confirm that your setup meets the necessary requirements. Not all Excel users have access to Copilot, as it is tied to specific Microsoft 365 plans and admin settings.
| Requirement | Details |
| Microsoft 365 Subscription | Microsoft 365 Personal, Family, Business, or Enterprise with Copilot add-on |
| Copilot License | Microsoft 365 Copilot license (approx. $30/user/month for business plans) |
| Excel Version | Excel for Microsoft 365 (desktop or web) – NOT Excel 2019 or 2021 standalone |
| Data Format | Data must be formatted as an Excel Table (Insert > Table) for best Copilot performance |
| Internet Connection | Required – Copilot processes prompts in Microsoft’s cloud infrastructure |
| File Location | File must be saved to OneDrive or SharePoint for full Copilot feature access |
| Language | Copilot works best in English; other languages are supported with varying accuracy |
When you use Copilot, your data is processed on Microsoft’s servers. Microsoft states it does not use your data to train underlying AI models. However, for sensitive personal, financial, or confidential business data, always review your organization’s data governance policy and consult your IT administrator before using Copilot.
How to Enable and Open Excel Copilot – Step by Step
Verify Your Microsoft 365 Subscription
Open any browser and go to portal.microsoft.com. Sign in with your Microsoft account. Confirm your subscription includes a Copilot license. If Copilot appears under your apps, you are ready. If not, your account administrator needs to assign a Copilot license to your user account.
Open Excel and Format Your Data as a Table
Open Excel with your data. Click any cell inside your data range. Press Ctrl+T or navigate to Insert > Table. Confirm the data range and check the box for My table has headers. Click OK. Formatting your data as a Table is the most important preparation step – Copilot reads structured table data significantly more accurately than plain cell ranges.
Open the Copilot Pane
In the Excel ribbon, click the Home tab. Look for the Copilot button – a colorful sparkle or four-square icon – in the right section of the ribbon. Click it. The Copilot pane will open on the right side of your screen. If you do not see the Copilot button, your Excel version may not yet have the update, or your organization may have restricted access through admin settings.
Activate Agent Mode
Inside the Copilot pane, look for an Agent Mode toggle or a mode selector at the top of the pane. In Excel versions from early 2025 onward, Agent Mode may be the default behavior when Copilot detects a multi-step request. If a mode selector is present, switch from Chat to Agent to enable autonomous multi-step actions.
The Copilot pane has a chat-style text input box at the bottom where you type prompts. Above it, Copilot’s responses appear – including text explanations, suggested actions, formula previews, and Accept or Reject buttons for any changes. A conversation history panel tracks the full session. Every Copilot action can be reversed with Ctrl+Z just like any standard Excel edit.
How to Write Effective Copilot Prompts for Data Analysis
The quality of Copilot’s output depends almost entirely on the quality of your prompt. Vague prompts produce vague results. Specific, context-rich prompts produce precise, actionable analysis. Use this five-element framework for every prompt you write:
| Prompt Element | What to Include | Example |
| Action verb | Start with what you want Copilot to do | Analyze, Summarize, Compare, Find, Create, Clean, Show, Highlight |
| Data reference | Name the table and relevant columns | in the Sales table, using the Revenue and Region columns |
| Filter or scope | Add time period or conditions | for Q3 2024, where Region equals North, for the top 10 rows only |
| Output format | Specify how you want results delivered | as a bar chart, as a summary paragraph, in a new sheet, as a sorted list |
| Business goal | State what decision this supports | to identify which products to prioritize next quarter |
Weak Prompt vs Strong Prompt – Side by Side
Weak Prompt (vague - produces poor results):
Analyze my data
Strong Prompt (specific - produces excellent results):
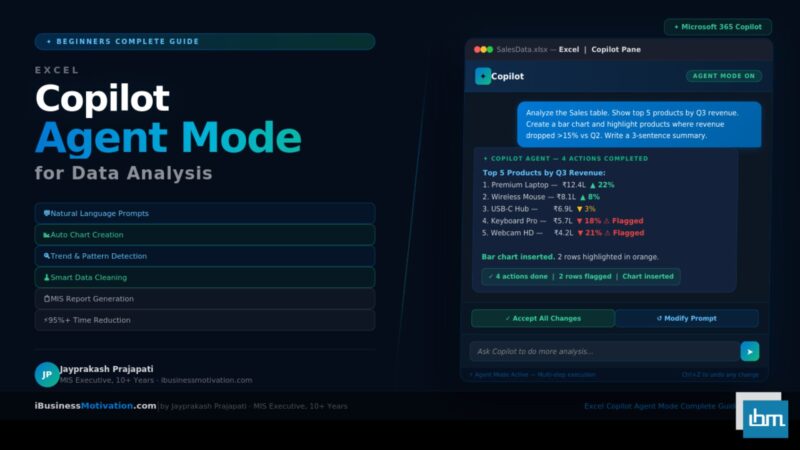
Analyze the Sales table. Show me the top 5 products by total revenue for Q3 2024.
Create a bar chart comparing their performance. Highlight any product where revenue
dropped more than 15% compared to Q2 2024. Write a 3-sentence executive summary of the findings.The strong prompt tells Copilot exactly which table to use, what to calculate, what type of chart to create, what condition to flag, and what written output to produce. This is the difference between a generic answer and a complete, polished, executive-ready analysis deliverable.
8 Real Data Analysis Tasks with Exact Copilot Prompts
Here are eight practical data analysis tasks that professionals need regularly, along with the exact Copilot Agent Mode prompts to use for each. These prompts are written to be used directly in the Copilot pane with minimal adjustment.
Task 1: Instantly Summarize an Entire Dataset
Use this prompt when you receive a new dataset and need a quick overview before deciding what analysis to run.
Copy and use this prompt:
Summarize the data in the Sales table. Tell me: total number of rows, the date range
covered, top 3 regions by total revenue, bottom 3 products by units sold, and the
overall revenue total. Present the summary as a numbered list.
Copilot Agent Mode will read the entire table, compute all the metrics, and write a structured summary directly in the chat pane – all in under 15 seconds regardless of how many rows your dataset has.
Task 2: Create a Professional Chart Without Manual Configuration
Instead of manually selecting a data range, choosing a chart type, configuring axes, and adding labels, simply describe the chart you want in words.
Copy and use this prompt:
Create a clustered column chart comparing monthly revenue by region (North, South,
East, West) for the full year 2024. Use a different color for each region. Add the
chart title 'Regional Revenue Comparison 2024' and display the value on top of
each bar.
Copilot will build the chart, apply the formatting you specified, and insert it directly into your worksheet. You can always click the chart afterward to make further manual refinements.
Task 3: Identify Sales Trends and Patterns
This is one of the most time-saving applications of Copilot Agent Mode – identifying patterns in time-series data that would take hours to find manually through formulas and conditional formatting.
Copy and use this prompt:
Analyze the monthly revenue data in the Revenue column. Identify the top 3 growth
months, the 3 lowest performing months, and any month where revenue dropped more
than 20% compared to the previous month. Highlight those drop months in orange and
write a 2-sentence explanation of the trend pattern.
What Copilot Handles Automatically: Copilot calculates all month-over-month percentage changes, identifies and flags qualifying months, applies conditional formatting to the correct rows, and writes an interpretation of the pattern – a combined task that would normally require multiple formulas, several conditional formatting rules, and manual written analysis.
Task 4: Clean Messy Data in One Prompt
Data cleaning is typically the most time-consuming part of any analysis project. Copilot Agent Mode can handle the most common cleaning tasks in a single, well-structured prompt.
Copy and use this prompt:
Clean the Customer table. Remove all duplicate rows based on the Email column.
Fix inconsistent capitalization in the Name column so all names are in Title Case.
Delete any rows where the Revenue column is blank or contains zero. After completing
the cleanup, show me a summary of how many rows were removed and what changes
were made.
Agent Mode executes each cleaning step sequentially, reports a change log in the pane, and leaves your data clean and analysis-ready. Always save a backup before running bulk cleaning operations.
Task 5: Build a Regional Summary Without Pivot Tables
Many beginners find Pivot Tables confusing and intimidating. Copilot can produce the same grouped, aggregated summary in a more conversational and accessible way.
Copy and use this prompt:
Group the data in the Orders table by Region. For each region calculate: total revenue,
average order value, and total number of orders. Create a new summary table on a new
sheet named 'Regional Summary'. Sort the results from highest to lowest total revenue.
Task 6: Forecast Future Values from Historical Data
Copilot can use historical data to project future trends, making it useful for budget planning, sales targets, and resource forecasting.
Copy and use this prompt:
Based on the monthly revenue data in column B for January through December 2024,
forecast the expected revenue for January, February, and March 2025 using linear
trend analysis. Add the forecast values in a new column C labeled 'Forecast 2025'
and create a line chart showing both actual 2024 values and forecasted 2025 values.
Task 7: Rank Top and Bottom Performers
Identifying your best and worst performers – whether salespeople, products, branches, or departments – is one of the most common recurring analysis tasks in any organization.
Copy and use this prompt:
From the Employee Performance table, identify the top 5 employees by total sales and
the bottom 5 employees by total sales for Q4 2024. Highlight top 5 rows in green and
bottom 5 rows in red. Create a side-by-side comparison table on a new sheet named
'Q4 Performance Summary' with columns for Name, Department, and Total Sales.
Task 8: Generate a Complete MIS Management Report
This is the highest-value prompt for MIS Executives, data analysts, and operations managers. A task that normally takes 2 to 4 hours of Monday morning work can be completed in under 5 minutes.
Copy and use this prompt:
Using the MasterData table, generate a management summary report including:
1. Total revenue by department
2. Headcount per department
3. Top 3 performing departments by revenue
4. Any department where expenses exceed budget by more than 10%
5. A 4-sentence executive summary paragraph of overall business performance.
Format the output as a clean report table with a bold heading row on a new sheet.
This single prompt replaces approximately 2 to 4 hours of manual MIS report preparation – the precise type of repetitive Monday morning workflow that consumes analyst time every week across organizations of every size.
Copilot Agent Mode vs Manual Analysis – Time Comparison
To understand the full productivity impact of Copilot Agent Mode, here is a direct comparison of the same seven analysis tasks performed manually versus with Copilot.
| Task | Manual Method | Manual Time | Copilot Agent Mode | Copilot Time |
| Dataset summary | Write SUM, COUNT, AVERAGE formulas manually | 25 to 40 minutes | Single prompt produces instant output | 30 seconds |
| Chart creation | Select data, Insert Chart, configure axes, add labels and formatting | 10 to 15 minutes | Describe chart in plain words – auto inserted | 20 seconds |
| Trend identification | Calculate % changes column, write conditional formatting rules, add notes | 45 to 60 minutes | One prompt flags all trends and writes explanation | 1 minute |
| Data cleaning | Manual find-and-replace, deduplication, blank row deletion | 30 to 90 minutes | One prompt cleans and reports all changes made | 1 to 2 minutes |
| Regional grouping | Build and configure Pivot Table, format and copy to new sheet | 15 to 25 minutes | Prompt creates grouped table on a new sheet | 45 seconds |
| Performance ranking | Sort, apply color rules, copy top and bottom rows to new sheet | 20 to 30 minutes | Prompt ranks, highlights, and builds report sheet | 30 seconds |
| MIS report build | Multiple formulas, formatting, manual copy-paste, written summary | 2 to 4 hours | Single comprehensive prompt with full output | 3 to 5 minutes |
Total Estimated Time Saved Across All 7 Tasks: Manual total: approximately 3.5 to 6 hours of analyst time. Copilot Agent Mode total: approximately 7 to 12 minutes. That is a time reduction of 95% or more for these common data analysis workflows – representing a genuine transformation in how Excel professionals spend their working hours.
Common Mistakes Beginners Make with Excel Copilot
| Mistake | Why It Happens | How to Avoid It |
| Data not in Table format | Using plain cell ranges instead of Excel Tables | Always press Ctrl+T to convert data to a Table before opening Copilot |
| Vague prompts with no context | Assuming Copilot knows what ‘my data’ means | Always name the table and specific columns in every prompt |
| Expecting Copilot to work offline | Not aware that cloud processing is required | Ensure a stable internet connection before starting a Copilot session |
| File saved locally on desktop | Copilot needs cloud-hosted files for full feature access | Always save the file to OneDrive or SharePoint first |
| Accepting all changes without reviewing | Trusting AI output blindly on financial or HR data | Review every Copilot change before distributing the output |
| Using Copilot on sensitive personal data | Not checking data governance rules first | Consult your IT administrator for guidance on data that leaves your network |
| Thinking Copilot changes cannot be undone | Unfamiliarity with the undo behavior | All Copilot actions are reversible with Ctrl+Z just like manual edits |
| Overloading one prompt with too many tasks | Trying to do everything in one step | Break complex workflows into 2 to 3 sequential focused prompts |
10 Pro Tips for Getting the Best Results from Excel Copilot
- Always format your data as an Excel Table first and give it a clear descriptive name like SalesData or EmployeeRecords – Copilot uses the table name to understand context.
- Start every new analysis session with a summary prompt to confirm Copilot is reading the right columns before you ask it to make any changes to your data.
- Use the word ‘explain’ in your prompt when you want Copilot to teach you something alongside doing it – for example: Create this formula and explain in plain English what each part does.
- Chain prompts sequentially for complex analysis tasks: first clean the data, then analyze it, then create the chart. Sequential focused prompts produce far better results than a single overloaded prompt.
- Tell Copilot exactly where to put the output – say create this on a new sheet named Summary or write the results in column F starting from row 2 to protect your existing data layout.
- Use conditional language for precise filtering: phrases like where revenue is greater than 50000 or if the status column contains Pending give Copilot explicit conditions to work with.
- Ask Copilot to verify its own work after a complex analysis: prompt Double-check the totals in column D against the sum of rows 2 to 500 and confirm they match.
- Always keep a backup copy of your file saved before running Agent Mode on important or production data files – while Ctrl+Z works for most edits, complex bulk operations are sometimes harder to cleanly reverse.
- Use Copilot to write formula explanations for your team: prompt Write a plain-English explanation of what this formula does, suitable for a non-technical reader.
- Combine Copilot with browser-based preparation tools for maximum productivity: use ibusinessmotivation.com tools to merge and clean files first, then use Copilot Agent Mode for deep analysis and professional reporting on the prepared data.
What Copilot Agent Mode Cannot Do – Honest Limitations
Copilot Agent Mode is powerful, but it has real limitations that every beginner should understand before relying on it for critical business output.
| Limitation | What This Means in Practice |
| Cannot access external data sources | Copilot only reads data already present in the open Excel file – no live web data, database queries, or API connections |
| Accuracy not guaranteed on complex logic | Always verify financial totals and multi-condition formula results – Copilot can make calculation errors |
| Performance degrades on very large files | Files with 500,000+ rows may process slowly or time out – filter data to a working range first |
| Limited on highly custom visualizations | Complex chart types like waterfall, Gantt, or custom scatter plots may require manual adjustment after Copilot creates a base version |
| No memory between sessions | Each new Excel session starts completely fresh – Copilot has no knowledge of what you discussed or built in previous sessions |
| Geographic and plan availability varies | Feature availability and Agent Mode rollout varies by region and Microsoft 365 plan as of early 2025 |
| Cannot interact with other apps from Excel | Sending emails, creating Word documents, or booking calendar events from Excel Copilot requires enterprise cross-app Copilot configuration |
Always Validate Before Sharing: For any analysis used in financial reports, management presentations, HR decisions, or external communications – always manually verify Copilot’s key figures against source data before distribution. Copilot is a productivity accelerator, not a substitute for human review and professional judgment.
Frequently Asked Questions About Excel Copilot Agent Mode
No. Excel Copilot requires a Microsoft 365 Copilot license, which is a paid add-on to standard Microsoft 365 subscriptions. As of 2025, the business license costs approximately $30 per user per month. Some personal Microsoft 365 subscriptions include limited Copilot features – check your plan details at portal.microsoft.com to see what is included.
No. Copilot requires an active internet connection because all prompt processing happens in Microsoft’s cloud infrastructure. It cannot function offline. If your organization handles data that cannot leave a local network for compliance reasons, consult your IT administrator about Microsoft’s sovereign cloud and data residency options.
Yes. Copilot can read, explain, and build upon existing formulas and pivot tables in your workbook. You can ask it to explain what a complex formula does in plain English, suggest more efficient alternatives, add calculated fields to a pivot table, or reformat an existing pivot table layout.
Your data is sent to Microsoft’s servers for AI processing. Microsoft has stated that data used in Copilot prompts is not used to train the underlying AI models and is protected under Microsoft’s enterprise data compliance commitments. However, terms may vary by subscription type and region – always review Microsoft’s current data privacy documentation and your organization’s own policies.
For routine, structured analysis tasks on well-organized data, Copilot significantly reduces the time and technical skill required to produce analysis output. However, it cannot replace human domain expertise, business judgment, or the ability to ask the right questions in the first place. Think of Copilot as a highly capable assistant that handles execution – while you remain responsible for strategy, interpretation, and verification.
Yes. Copilot works in Excel for the web at office.com in addition to the desktop application, provided the file is saved to OneDrive or SharePoint. Some advanced features and Agent Mode capabilities may be more fully featured in the desktop version – always check the Microsoft 365 release notes for your version.
Yes. You can prompt Copilot to generate VBA macro code directly. For example: Write a VBA macro that removes blank rows, bolds the header row, and auto-fits all columns. Copilot will produce the code which you can copy into the Excel VBA Editor with Alt+F11. This is an excellent way to learn VBA while also getting your automation tasks completed.
ChatGPT and similar tools operate outside Excel and cannot directly read or modify your actual Excel files – you would need to copy and paste data in and out. Excel Copilot Agent Mode is embedded inside Excel, has direct access to your live workbook data, and can apply changes directly to your cells, charts, and sheets without any copy-paste workflow. For Excel-specific tasks, Copilot Agent Mode is significantly more efficient and accurate.
Summary: Your Excel Copilot Agent Mode Learning Roadmap
Excel Copilot Agent Mode represents the most significant productivity shift for Excel users since the introduction of pivot tables. For the first time, you do not need to know which functions, steps, or tools to use – you describe the result you want, and the AI works out the path to get there.
| Your Level | Focus On | Try This First Prompt |
| Complete Beginner | Format data as Table, open Copilot, run first summary | Summarize this table and tell me the total and average of every numeric column |
| Beginner | Chart creation and basic data cleaning prompts | Create a column chart of revenue by region and remove any duplicate rows |
| Beginner+ | Trend analysis and conditional highlighting | Find months where revenue dropped more than 15% and highlight them in yellow |
| Intermediate | Multi-step reports, forecasting, cross-sheet outputs | Create a management summary comparing this quarter to last quarter on a new sheet |
| Advanced | Full end-to-end analysis workflows with chained prompts | Clean the data, analyze trends, create three charts, and write an executive summary |
The fastest way to learn Copilot is to use it on real data you already work with. Open Excel right now, format your data as a Table, click the Copilot button, and type your first prompt. Within one session, you will discover exactly how much time AI can return to your work week.
Combine Tools for Maximum Efficiency: For the most efficient Excel workflow in 2025: use the free browser-based tools at ibusinessmotivation.com to merge multiple files, clean duplicates, and split by region – then bring the clean, prepared data into Excel and use Copilot Agent Mode for deep analysis, visualization, and professional report generation. Together, these tools eliminate virtually every manual, repetitive task in a typical analyst workflow.