

Every business – from a two-person startup to a 500-employee corporation – runs on repetitive processes. Weekly reports. Monthly payroll summaries. Daily inventory checks. Quarterly sales analyses. These tasks consume thousands of hours every year, year after year. And in the vast majority of companies across India and the world, the tool sitting at the center of all of this work is Microsoft Excel.
The good news: Excel is not just a data storage tool. It is a full-scale automation platform. With the right combination of formulas, Power Query, VBA macros, and dashboards, you can transform tasks that take hours into processes that complete themselves in minutes – or even automatically the moment data is updated.
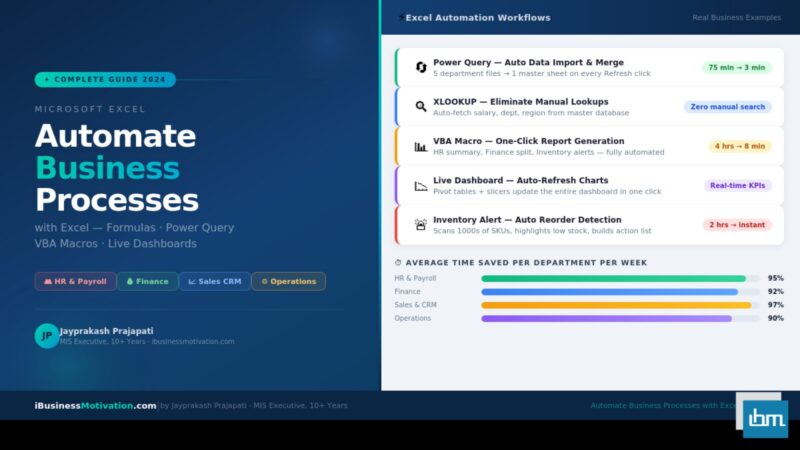
This guide covers every major Excel automation method available today, with real examples organized by business department – HR, Finance, Sales, and Operations. Whether you run a small business or manage enterprise-level reporting, you will find practical, immediately applicable techniques here.
Why Excel Is the #1 Business Automation Tool
Before exploring techniques, it is worth understanding why Excel – and not a dedicated automation platform – is the right starting point for most businesses.
| Factor | Excel Advantage |
| Cost | Already installed on virtually every business computer – zero additional software cost |
| Skill availability | More Excel-skilled professionals available than any other data tool in the world |
| Flexibility | Works for any industry, any department, any business size |
| Integration | Connects natively with CSV, SQL, Access, SharePoint, Power BI, and Outlook |
| No IT dependency | Business users can build and maintain their own automation without IT support |
| Scalability | Start with simple formulas; grow into Power Query and VBA as needs expand |
Stat: Business Time Waste Research by McKinsey found that knowledge workers spend approximately 19% of their working week – nearly one full day – searching for and gathering information that could be automated. In Excel-heavy roles like MIS, Finance, and HR operations, this figure is often even higher.
The five levels of Excel automation, ordered from simplest to most powerful, are: smart formulas, named ranges and data validation, Power Query, VBA macros, and connected dashboards. Each level builds on the previous one, and most business automation needs can be solved at level two or three – without writing a single line of code.
Smart Formulas and Dynamic Data Validation
The fastest way to begin automating business processes in Excel is to replace manual lookups, manual calculations, and manual data entry with smart formulas that calculate themselves the moment data changes.
Replace Manual Lookups with XLOOKUP
Every business maintains master lists: employee directories, product catalogs, vendor databases, customer records. When someone needs a specific piece of information – a salary, a product price, a customer’s region – the manual process is to search, find, and copy. XLOOKUP eliminates that entirely.
' Auto-fetch employee department when ID is entered in A2:
=XLOOKUP(A2, EmployeeDB!A:A, EmployeeDB!C:C, "Not Found")

' Auto-fetch product price from price list:
=XLOOKUP(B5, PriceList!A:A, PriceList!D:D, 0)

' Two-way lookup: Sales figure for Region + Month:
=XLOOKUP(F2, RegionList!A:A, XLOOKUP(G2, MonthRow!B1:M1, MonthRow!B2:M13))
Automate Calculations with Dynamic Array Formulas
Excel’s newer dynamic array functions – FILTER, SORT, UNIQUE, and SUMIFS – can replace entire manual reporting steps. Instead of copying and pasting data, filtering it manually, and creating summary rows by hand, one formula does all of it.
' Auto-filter all Sales team employees from HR master sheet:',
=FILTER(A2:D200, C2:C200="Sales", "No records")

' Auto-generate unique region list from raw data:
=UNIQUE(B2:B500)

' Auto-sort sales report by revenue, descending:
=SORT(A2:D50, 4, -1)

' Total salary for each department automatically:
=SUMIFS(SalaryCol, DeptCol, "Finance")
Use Named Ranges for Cleaner Formulas: Instead of referencing B2:B500 in every formula, name your ranges using the Name Manager (Ctrl+F3). A formula like =SUMIFS(Salary, Department, “Finance”) is far more readable and maintainable than =SUMIFS($C$2:$C$500, $B$2:$B$500, “Finance”). Named ranges also update automatically when data grows.
Prevent Data Entry Errors with Drop-Down Validation
Manual data entry is the single largest source of errors in business spreadsheets. A misspelled department name, a wrong product code, or an invalid date can corrupt reports and cause costly decisions. Data Validation forces users to select from a predefined list instead of typing freely.
- Select the cell or column where data will be entered.
- Go to Data > Data Validation > Data Validation.
- In the Allow dropdown, select List.
- In the Source field, enter your list range (e.g., =DepartmentList!A2:A10) or type values directly.
- In the Error Alert tab, write a custom message explaining what valid input looks like.
- Click OK. Users can now only select from the approved list.
| Validation Type | Best Used For | Example |
| List (Dropdown) | Department, Region, Status, Category | Sales, HR, Finance, Operations |
| Whole Number | Quantities, counts, employee IDs | Only allow 1 to 9999 |
| Decimal | Prices, percentages, weights | Only allow 0.00 to 100.00 |
| Date | Invoice dates, joining dates, deadlines | Only allow dates after 01/01/2020 |
| Text Length | Product codes, reference numbers | Only allow exactly 8 characters |
| Custom (Formula) | Complex business rules | Prevent duplicate entries using COUNTIF |
Power Query: The Most Powerful No-Code Automation Tool in Excel
Power Query is the single most valuable Excel automation feature that most business users have never used. It is available in Excel 2016 and all later versions under the Data tab, and it can completely eliminate the most time-consuming manual data tasks in any business. Where formulas work on data already inside Excel, Power Query handles the step before that – getting data into Excel, cleaning it, and shaping it correctly, automatically, every time you refresh.
| Manual Process | Power Query Automation |
| Copy-paste from 5 department files every Monday | Merge all files automatically – one Refresh click |
| Manually remove blank rows and fix formatting | Cleaning steps run automatically on every refresh |
| Sort, filter, and reformat raw exported data | Transformations are saved and replay on new data |
| Create a summary table from raw transactional data | Group By and Aggregate runs automatically |
| Combine 12 monthly CSV files into one annual report | Folder connector imports all files in one step |
| Look up values across two different data sources | Merge Queries (Excel’s native VLOOKUP equivalent) |
Connect to a Data Source
Power Query can connect to almost any data source a business uses: Excel files, CSV files, SQL databases, SharePoint lists, web pages, JSON APIs, and more.
- Go to Data > Get Data in the Excel ribbon.
- Choose your source type: From File (Excel, CSV, Folder), From Database, From Online Services, or From Other Sources.
- Navigate to your file or enter your connection string.
- Power Query opens the Query Editor, showing a preview of your data.
All transformation steps you perform are recorded and replayed on every future refresh.
The Most Useful Power Query Transformations for Business
| Transformation | What It Does | Business Use Case |
| Remove Duplicates | Eliminates repeated rows based on selected columns | Clean merged data from multiple branches |
| Fill Down | Fills blank cells with the value from above | Fix exported reports with merged cells |
| Split Column | Splits one column into multiple on a delimiter | Separate full name into first and last name |
| Unpivot Columns | Converts wide tables (months as columns) to tall tables | Normalize monthly sales data for analysis |
| Group By | Summarizes data by category with Sum, Count, Average | Department-wise headcount or revenue totals |
| Merge Queries | Joins two tables like VLOOKUP | Add department names to a transaction sheet |
| Append Queries | Stacks multiple tables vertically | Combine 12 monthly files into one annual sheet |
| Custom Column | Adds a calculated column using M formula language | Calculate commission = Sales × Rate |
| Change Type | Converts columns to correct data type | Fix dates stored as text, numbers stored as text |
| Filter Rows | Keeps only rows matching a condition | Show only active employees or open invoices |
Automate Monthly File Imports with a Folder Connector Instead of manually importing each month’s export file, use Get Data > From File > From Folder and point to the folder where monthly files are saved. Power Query will automatically pick up every file in that folder. When you save January’s file to the folder, one click of Refresh updates your report with the new month’s data – no manual import needed.
Refresh Automation: One Click Updates Everything
Once your Power Query steps are defined, updating your report with new data is a single click. Go to Data > Refresh All, and every query in the workbook re-runs: it fetches fresh data, applies all transformations, and updates all connected charts and pivot tables automatically.
For businesses that need truly automatic updates, Excel also supports scheduled background refresh when connected to SharePoint or Power BI. For most small and mid-sized businesses, the manual Refresh All on Monday morning – combined with automated cleaning and merging – is already a dramatic improvement over fully manual workflows.
VBA Macros: Full Business Process Automation
When a task requires logic – decisions, loops, conditional actions, user interaction, or cross-application control – VBA macros provide the answer. VBA is Excel’s built-in programming language, and it can automate virtually any business process that happens inside (or through) Excel.
HR Automation: Payroll Summary and Employee Report Generation
HR teams typically spend 3 to 5 hours every month manually compiling headcount reports, department summaries, and payroll totals. This macro generates a full department-wise summary in seconds:
Sub GenerateHRSummary()
    Dim wsData As Worksheet, wsSummary As Worksheet
    Dim lastRow As Long, i As Long

    Set wsData = Sheets("EmployeeData")
    lastRow = wsData.Cells(wsData.Rows.Count, 1).End(xlUp).Row

    ' Create or clear summary sheet
    On Error Resume Next: Sheets("HRSummary").Delete: On Error GoTo 0
    Set wsSummary = Sheets.Add(After:=Sheets(Sheets.Count))
    wsSummary.Name = "HRSummary"

    ' Headers
    wsSummary.Range("A1:E1").Value = Array("Department", "Headcount", _
        "Total Salary", "Avg Salary", "% of Workforce")
    wsSummary.Rows(1).Font.Bold = True
    wsSummary.Rows(1).Interior.Color = RGB(31, 78, 121)
    wsSummary.Rows(1).Font.Color = vbWhite

    ' Build unique department list and compute metrics
    Dim depts As New Collection
    On Error Resume Next
    For i = 2 To lastRow
        depts.Add wsData.Cells(i, 3).Value, CStr(wsData.Cells(i, 3).Value)
    Next i
    On Error GoTo 0

    Dim r As Integer: r = 2
    Dim d As Variant
    Dim totalStaff As Long: totalStaff = lastRow - 1
    For Each d In depts
        Dim cnt As Long, tot As Double
        cnt = Application.CountIf(wsData.Range("C2:C" & lastRow), d)
        tot = Application.SumIf(wsData.Range("C2:C" & lastRow), d, wsData.Range("D2:D" & lastRow))
        wsSummary.Cells(r, 1).Value = d
        wsSummary.Cells(r, 2).Value = cnt
        wsSummary.Cells(r, 3).Value = tot
        wsSummary.Cells(r, 4).Value = IIf(cnt > 0, tot / cnt, 0)
        wsSummary.Cells(r, 5).Value = Format(cnt / totalStaff, "0.0%")
        r = r + 1
    Next d
    wsSummary.Columns.AutoFit
    MsgBox "HR Summary generated! " & (r-2) & " departments processed.", vbInformation
End Sub
Finance Automation: Auto-Generate and Email Monthly Reports
Finance teams deal with repetitive monthly closing processes – consolidating data, generating P&L summaries, and distributing reports to management. This macro splits a master financial report by department and saves each as a separate file:
Sub SplitAndSaveFinanceReports()
    Dim ws As Worksheet, newWb As Workbook
    Dim lastRow As Long, i As Long
    Dim dept As String, savePath As String

    Set ws = Sheets("MasterFinance")
    lastRow = ws.Cells(ws.Rows.Count, 1).End(xlUp).Row
    savePath = Environ("USERPROFILE") & "\Desktop\FinanceReports\"
    If Dir(savePath, vbDirectory) = "" Then MkDir savePath

    ' Get unique department list
    Dim depts As New Collection
    On Error Resume Next
    For i = 2 To lastRow
        depts.Add ws.Cells(i, 2).Value, CStr(ws.Cells(i, 2).Value)
    Next i
    On Error GoTo 0

    Application.ScreenUpdating = False
    For Each dept In depts
        ' Copy master sheet to new workbook
        ws.Copy
        Set newWb = ActiveWorkbook
        ' Filter to keep only this department
        newWb.Sheets(1).UsedRange.AutoFilter Field:=2, Criteria1:=dept
        newWb.SaveAs savePath & dept & "_Report_" & Format(Now, "MMYYYY") & ".xlsx"
        newWb.Close False
    Next dept
    Application.ScreenUpdating = True
    MsgBox "Reports saved to: " & savePath, vbInformation
End Sub
Sales Automation: Daily Performance Dashboard Refresh
Sales managers need up-to-date performance data without asking analysts to manually update spreadsheets. This macro imports the latest sales CSV export, cleans it, and refreshes all pivot tables and charts – ready for the morning standup meeting.
Sub RefreshSalesDashboard()
    Dim wb As Workbook
    Dim csvPath As String
    Dim ws As Worksheet

    csvPath = "C:\SalesData\daily_export.csv"

    ' Check file exists',
    If Dir(csvPath) = "" Then
        MsgBox "Sales export file not found! Check: " & csvPath, vbCritical
        Exit Sub
    End If

    ' Import CSV into RawData sheet',
    Set ws = Sheets("RawData")
    ws.Cells.ClearContents
    With ws.QueryTables.Add(Connection:="TEXT;" & csvPath, _
        Destination:=ws.Range("A1"))
        .TextFileParseType = xlDelimited
        .TextFileCommaDelimiter = True
        .Refresh BackgroundQuery:=False
    End With

    ' Refresh all pivot tables and Power Query connections
    Dim pt As PivotTable
    For Each ws In ThisWorkbook.Sheets
        For Each pt In ws.PivotTables
            pt.RefreshTable
        Next pt
    Next ws
    ThisWorkbook.RefreshAllConnections

    MsgBox "Sales Dashboard updated as of " & Format(Now, "DD-MMM-YYYY HH:MM"), vbInformation
End Sub
Operations Automation: Inventory Alert System
Operations teams need to know immediately when stock drops below reorder levels. This macro scans the inventory sheet and highlights low-stock items, then lists them in a summary tab – creating a reorder action list automatically:
Sub InventoryAlertSystem()
    Dim wsInv As Worksheet, wsAlert As Worksheet
    Dim lastRow As Long, i As Long, alertRow As Integer

    Set wsInv = Sheets("Inventory")
    lastRow = wsInv.Cells(wsInv.Rows.Count, 1).End(xlUp).Row

    ' Create or clear alert sheet
    On Error Resume Next: Sheets("ReorderAlert").Delete: On Error GoTo 0
    Set wsAlert = Sheets.Add(After:=Sheets(Sheets.Count))
    wsAlert.Name = "ReorderAlert"
    wsAlert.Range("A1:D1").Value = Array("SKU", "Product Name", "Current Stock", "Reorder Level")
    wsAlert.Rows(1).Font.Bold = True
    wsAlert.Rows(1).Interior.Color = RGB(192, 57, 43)
    wsAlert.Rows(1).Font.Color = vbWhite
    alertRow = 2

    Application.ScreenUpdating = False
    For i = 2 To lastRow
        Dim currentStock As Long, reorderLevel As Long
        currentStock = wsInv.Cells(i, 4).Value   ' Column D: Current Stock
        reorderLevel = wsInv.Cells(i, 5).Value   ' Column E: Reorder Level

        If currentStock <= reorderLevel Then
            ' Highlight red on inventory sheet
            wsInv.Rows(i).Interior.Color = RGB(255, 204, 204)
            ' Copy to alert sheet
            wsAlert.Cells(alertRow, 1).Value = wsInv.Cells(i, 1).Value
            wsAlert.Cells(alertRow, 2).Value = wsInv.Cells(i, 2).Value
            wsAlert.Cells(alertRow, 3).Value = currentStock
            wsAlert.Cells(alertRow, 4).Value = reorderLevel
            alertRow = alertRow + 1
        End If
    Next i
    Application.ScreenUpdating = True
    wsAlert.Columns.AutoFit
    MsgBox (alertRow - 2) & " items need reordering. See ReorderAlert sheet.", vbExclamation
End Sub
Dashboard Automation with Dynamic Charts
The final level of Excel business automation is the connected dashboard – a single sheet that automatically reflects the latest data from all sources, updates charts instantly, and gives decision-makers a real-time view of business performance without any manual intervention.
The Building Blocks of an Automated Dashboard
| Component | Purpose | How to Build It |
| Power Query | Imports and cleans raw data automatically | Get Data > From File or Database; define transformations |
| Pivot Tables | Summarizes data by any dimension dynamically | Insert > PivotTable on cleaned data |
| Pivot Charts | Visualizes pivot table data automatically | Click inside PivotTable > Insert > PivotChart |
| Slicers | Lets users filter the entire dashboard with one click | Insert > Slicer; connect to all pivot tables |
| Named Ranges | Makes formulas readable and maintainable | Formulas > Name Manager > New |
| INDIRECT + validation | Creates dependent dropdowns for drill-down analysis | Data Validation with INDIRECT reference to named range |
| Conditional Formatting | Highlights KPIs and anomalies automatically | Home > Conditional Formatting > New Rule |
| Data Bars / Icon Sets | Shows performance visually inside cells | Conditional Formatting > Data Bars or Icon Sets |
The 5-Minute Dashboard Refresh Workflow
A well-built Excel dashboard requires almost no maintenance once set up. The entire weekly reporting workflow is reduced to a predictable 5-step process:
- Step 1 – Save new data file to the designated folder (the same location Power Query monitors).
- Step 2 – Open the dashboard workbook and press Ctrl+Shift+F9 or go to Data > Refresh All.
- Step 3 – All pivot tables update automatically with the fresh data – no manual adjustment.
- Step 4 – All charts refresh instantly since they are connected to pivot tables.
- Step 5 – Review, screenshot, or email the dashboard to stakeholders.
Total Time with Automation
The first time you build this system: 3 to 5 hours. Every subsequent week: 5 minutes. Over a one-year period (52 weeks), a process that previously took 3 hours per week saves approximately 150 hours annually – the equivalent of nearly 4 full working weeks returned to your team.
Excel Automation by Department – Quick Reference
Different departments have different automation priorities. Here is a department-by-department breakdown of the most impactful automation opportunities available in Excel:
Human Resources
| Process | Manual Time | With Excel Automation | Time Saved |
| Monthly headcount report | 3 hours | 8 minutes | 97% |
| Payroll summary by department | 2 hours | 5 minutes | 96% |
| New joiner data entry & validation | 45 mins | 10 mins (with forms) | 78% |
| Leave balance tracking | 2 hours/week | Auto-updated dashboard | 95% |
| Attrition and tenure analysis | 4 hours | One-click VBA report | 97% |
Finance and Accounting
| Process | Manual Time | With Excel Automation | Time Saved |
| Monthly P&L consolidation | 5 hours | 15 minutes | 95% |
| Invoice matching and reconciliation | 4 hours | Power Query merge query | 90% |
| Budget vs actuals comparison | 3 hours | Auto-updating pivot dashboard | 93% |
| Tax report preparation | 6 hours | Formula-driven template | 85% |
| Vendor payment summary | 2 hours | SUMIFS + dynamic filter | 92% |
Sales and CRM
| Process | Manual Time | With Excel Automation | Time Saved |
| Weekly sales performance report | 3 hours | Refresh All: 5 minutes | 97% |
| Territory/region-wise split | 2 hours | Worksheet Split macro | 95% |
| Lead pipeline status tracking | 1 hour/day | Auto-filtered dashboard | 90% |
| Commission calculation | 3 hours | Formula with IF + VLOOKUP | 88% |
| Customer purchase history lookup | 30 mins/query | XLOOKUP on master table | 95% |
Operations and Supply Chain
| Process | Manual Time | With Excel Automation | Time Saved |
| Inventory reorder alert | 2 hours/week | VBA alert macro | 95% |
| Supplier performance scoring | 4 hours | Weighted formula dashboard | 92% |
| Production schedule tracking | 3 hours | Dynamic Gantt chart | 85% |
| Warehouse-wise stock split | 2 hours | Worksheet Split tool | 95% |
| Dispatch and delivery log | 1 hour/day | Auto-timestamped entry form | 80% |
ROI of Excel Automation – The Business Case
Automation investments must be justified. Here is how to calculate the actual return on investment from Excel automation in your organization:
| Metric | Example Values |
| Hourly cost of an analyst or MIS executive | Rs. 300 to Rs. 600 per hour |
| Hours saved per week with Excel automation | 8 to 15 hours (conservative estimate) |
| Weekly cost savings | Rs. 2,400 to Rs. 9,000 per week |
| Annual cost savings (50 working weeks) | Rs. 1,20,000 to Rs. 4,50,000 per analyst |
| Time to build automation (one-time) | 10 to 30 hours depending on complexity |
| Break-even point | Typically 1 to 3 weeks after deployment |
| Additional value: Error reduction | Prevents costly reporting errors worth far more than time savings |
These numbers are conservative. In high-volume reporting environments – sales operations, finance consolidation, MIS reporting – the savings are often 3 to 5 times higher. The break-even on any well-designed Excel automation is almost always within the first month.
Common Excel Automation Mistakes to Avoid
| Mistake | Why It Is a Problem | Better Approach |
| Hardcoding values in formulas | Values like row counts and sheet names break when data changes | Use dynamic references: Cells(Rows.Count,1).End(xlUp).Row |
| No error handling in VBA macros | Macro crashes mid-process and leaves data in inconsistent state | Add On Error GoTo ErrorHandler with cleanup code |
| Sharing .xlsx files with macros | Excel strips all VBA code when saving as .xlsx | Always save automation workbooks as .xlsm |
| Building automation on unstructured data | Power Query and formulas break on inconsistently formatted source data | Standardize source formats before building automation |
| No documentation or comments | Future team members cannot understand or maintain the automation | Add comment headers and inline comments to every macro |
| Over-automating too quickly | Building complex automation before understanding the process leads to wrong outputs | Automate the most painful, repetitive step first; expand gradually |
| Skipping backups | Macros that delete or overwrite data cannot be undone | Always backup before running new macros on live data |
Test on Sample Data First
Never run a new VBA macro or Power Query transformation on your live production data for the first time. Always create a test copy of the workbook with a 10-20 row sample and verify the output is exactly correct before applying it to full datasets.
Free Excel Automation Tools at ibusinessmotivation.com
For teams that need automation results immediately – without the time investment of learning Power Query or VBA – browser-based Excel tools provide the same outcomes in minutes, with zero technical knowledge required.
| Tool | What It Automates | Time Saved vs Manual |
| Multiple Excel File Merger | Merging 2 to 20 department files into one master sheet | 75 minutes → 3 minutes |
| Excel Data Cleaner | Remove duplicates, fix formatting, eliminate blank rows | 65 minutes → 2 minutes |
| Excel Worksheet Split Tool | Split master sheet by any column value (region, dept, rep) | 55 minutes → 4 minutes |
| CSV to Excel Converter | Batch-convert multiple CSV exports to formatted Excel files | 30 minutes → 2 minutes |
| Excel Row Filter Tool | Filter and extract rows based on any condition | 40 minutes → 3 minutes |
These tools are available free for files up to 2MB at ibusinessmotivation.com. For larger files and batch processing, premium plans start at Rs. 299 per month with a 7-day money-back guarantee.
Frequently Asked Questions About Excel Business Automation
For most small to medium-sized businesses, Excel handles 80 to 90 percent of automation needs with no additional cost. Dedicated platforms like Zapier, Power Automate, or ERP systems become necessary when automation needs to cross multiple cloud applications simultaneously, when real-time triggers are required, or when the data volume exceeds Excel’s practical limits (roughly 500,000 to 1 million rows).
Power Query is the right starting point. It is visual, no-code, and handles the most common automation needs – data import, cleaning, merging, and shaping. VBA is better for tasks requiring logic: decisions, loops, user interaction, email sending, and cross-application control. Most business users only ever need Power Query. VBA is for power users and MIS professionals who need maximum control.
Excel itself cannot run fully unattended without a person opening it. However, you can schedule a VBA macro to run automatically every time the workbook is opened using the Workbook_Open event. For fully unattended scheduled automation, combine Excel with Windows Task Scheduler to open the workbook at a scheduled time, which then triggers the Workbook_Open macro automatically.
Power Query is compatible with Excel 2016 and later. Dynamic array formulas (FILTER, SORT, UNIQUE) require Excel 2019 or Microsoft 365. XLOOKUP requires Excel 2021 or Microsoft 365. VBA macros are compatible across all versions from Excel 2007 onwards, though some newer object references may need version checks. Always test on the oldest Excel version your team uses.
Excel’s hard limit is 1,048,576 rows per sheet. Power Query can handle multi-million row datasets by loading data into the Data Model instead of the worksheet. For most business automation use cases – HR records, sales data, inventory, financial transactions – Excel comfortably handles datasets up to 500,000 rows with good performance.
Exercise caution. Malicious macros exist and can execute code on your computer when a file is opened. Excel’s macro security settings (File > Options > Trust Center > Macro Settings) should be set to Disable All Macros with Notification for files from unknown sources. Only enable macros in workbooks from trusted colleagues or vendors whose code you or a technical team member has reviewed.
Summary: Your Excel Business Automation Action Plan
Excel automation is not a single tool or a single technique – it is a layered system that you build progressively as your confidence and requirements grow. Here is a recommended action plan for every business type:
| Week | Action | Expected Outcome |
| Week 1 | Audit your top 3 most repetitive weekly Excel tasks and measure time taken | Clear picture of where automation will save the most time |
| Week 2 | Replace manual lookups with XLOOKUP; add data validation to key entry columns | Immediate error reduction and 30-60 min weekly savings |
| Week 3 | Set up one Power Query connection for your most painful data import task | Eliminate weekly manual import and cleaning time entirely |
| Week 4 | Build one simple VBA macro for your most repetitive formatting or reporting task | One-click automation of a previously multi-step manual process |
| Month 2 | Connect your automated data to a pivot table dashboard with slicers | Real-time reporting dashboard requiring only a weekly Refresh All |
| Month 3 | Expand automation to second department; document all processes | Automation system that works without you being present |
The companies that save the most time are not those with the most advanced tools – they are those that consistently apply simple automation to their most painful, repetitive processes. Start with one workflow. Build it well. Measure the time saved. Then expand.
Start Here Today: If you are new to Excel automation, the fastest win is Power Query. Go to Data > Get Data > From File > From Workbook in Excel right now, connect it to your most-used data file, and explore the Query Editor. You do not need to write a single formula or line of code to experience the power of automatic data refresh.